Introduction to data modeling in Power BI

Data modeling is one of the important steps to do before developing Power BI dashboard. It is critical to have a well-designed data model to fully communicate and reflect your organization’s datasets in a visual representation.
Knowing your data tables and familiarizing yourself with the relationships is very important and will give you an advantage later when starting visualizing and adding slicers or drill-through between charts. if you have a well-designed and organized data model then your workflow will be smoother and you will not need to switch between Report and Data tabs.

A data model can be of different types based on structure, shape, and properties. Some types of data models are the Hierarchical Model, Relational Model, Network Model, Entity-Relationship Model, and many more. For Power BI, we will be more focused on the Entity-Relationship Model.
Entity-Relationship Model (ER Model)
The entity is an object, subject, or event in a model. For Example, color, model & Type are entities that define the car. Thus Entity-Relationship model is the relation between multiple entities. In a table, Entities are the values (like Tesla, Sport, Red), whereas Entity Attributes are the characteristics and properties (like ID, Name, Type, Color). The ER Model is not complete without some important keys. These keys represent a special property. There are two types of keys: Primary keys and Foreign keys. in the two tables below. Id in table 1 is the primary key, and Car Id in the second table is the Foreign key.


Relationships between tables
A model relationship connects one column in a table to one column in a different table. in the example above, table one represents the main or core table and the second table is the models table. if we are creating a relationship between the two tables it would be one-to-one cardinality type which means both columns contain unique values. to understand relationships between tables we need to know the types of cardinality and what does cardinality means.
Cardinalities
Cardinality is a mathematical term. It translates into the number of elements in a set. In databases, cardinality refers to the relationships between the data in two database tables. Cardinality defines how many instances of one entity are related to instances of another entity. There is four type of cardinality options:
- One-to-many (1:*)
- Many-to-one (*:1)
- One-to-one (1:1)
- Many-to-many (*:*)
One-to-many (and many-to-one) cardinality
Basically, one-to-many and many-to-one cardinality options are the same. When configuring a one-to-many or many-to-one relationship, you will choose a unique ID in one of the tables and a duplicated ID’s in the second table and vice-versa. a good example of this cardinality type is a relationship between the student's table and the grades table ( one-to-many).
One-to-one cardinality
A one-to-one relationship means both columns contain unique values. For example, a relationship between students table where each student has a unique ID and contacts info. each student has only one contact information and address hence one-to-one.
Many-to-many cardinality
A many-to-many relationship means both columns can contain duplicate values. A typical example of a many-to-many relationship is one between students and classes. A student can register for many classes, and a class can include many students. So let’s say we have a Student table, which contains a record for each student, and a Class table, which contains a record for each class. A join table, Enrollments, create two one-to-many relationships — one between each of the two tables.
Now that we understood Relationships and Cardinalities. Let’s talk about the design principles of data. According to PowerBI documentation, it’s recommended to use Star schema when designing a data model that contains dimensions and fact tables. but what is a star schema approach?
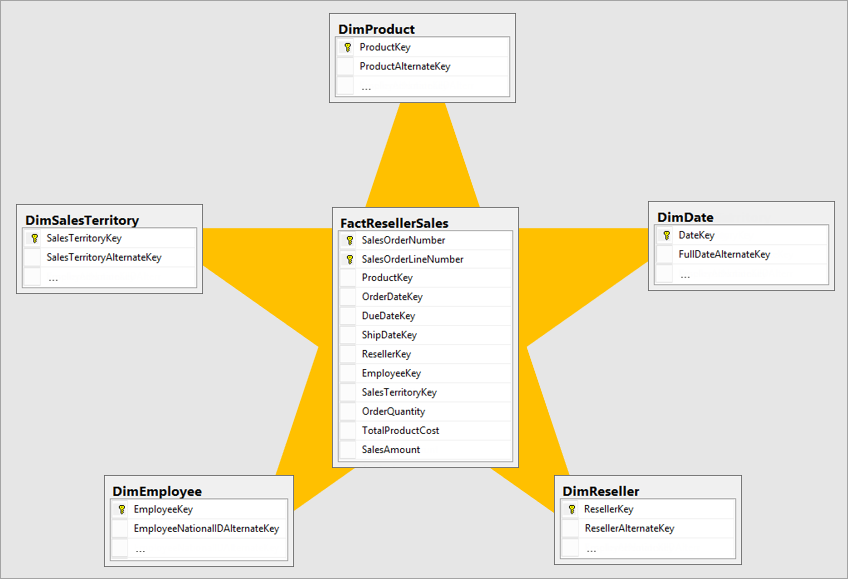
Star schema
It’s a mature modeling approach widely used by relational data warehouses. It requires developers to categorize their model tables as either dimension or fact. Dimension tables describe business entities while Fact tables store observations or events.
You may ask how this would be relevant to Power BI modeling and why it’s important. Well simply because each Power BI report visual generates a query that is sent to the Power BI model. These queries are used to filter, group, and summarize model data. The perfect model, then, is the one that provides tables for filtering and grouping, and tables for summarizing.
